What do you need to consider when calculating battery storage costs for your project? A rudimentary analysis would simply look at the capital expenditure (CAPEX) for the battery or storage system itself, but this method is blind to certain ongoing costs. A more impactful method needs to account for the operational profile of the battery.
In a previous post, we discussed how various energy storage cost components impact project stakeholders in different ways. For most stakeholders, Levelized Cost of Storage (LCOS) and Levelized Cost of Energy (LCOE) are the best measures of the impact of energy storage in an energy project. Largely, that’s because these methods factor in the operational profile of the battery.
Read on as we explain the significant drivers and components of battery storage costs, and compare the costs of two different battery technologies.
Major Drivers of Battery Storage Costs
As we’ve mentioned before, both LCOE and LCOS are expressed as units of currency per unit of stored energy discharged (e.g. $/MWh or £/MWh); they express costs of lifetime MWh throughput as opposed to MWh of installed capacity. As you begin your analysis it’s important to bear in mind that several inter-related factors drive these costs.
The first step in calculating the costs of battery storage for commercial or grid-scale project is to define what you expect the battery will do. How many times a day will it cycle? When will it charge, and from what sources? Are you using the battery to avoid peak demand charges, to provide balancing services, to trade on the wholesale market, or to combine one or more of these value streams?
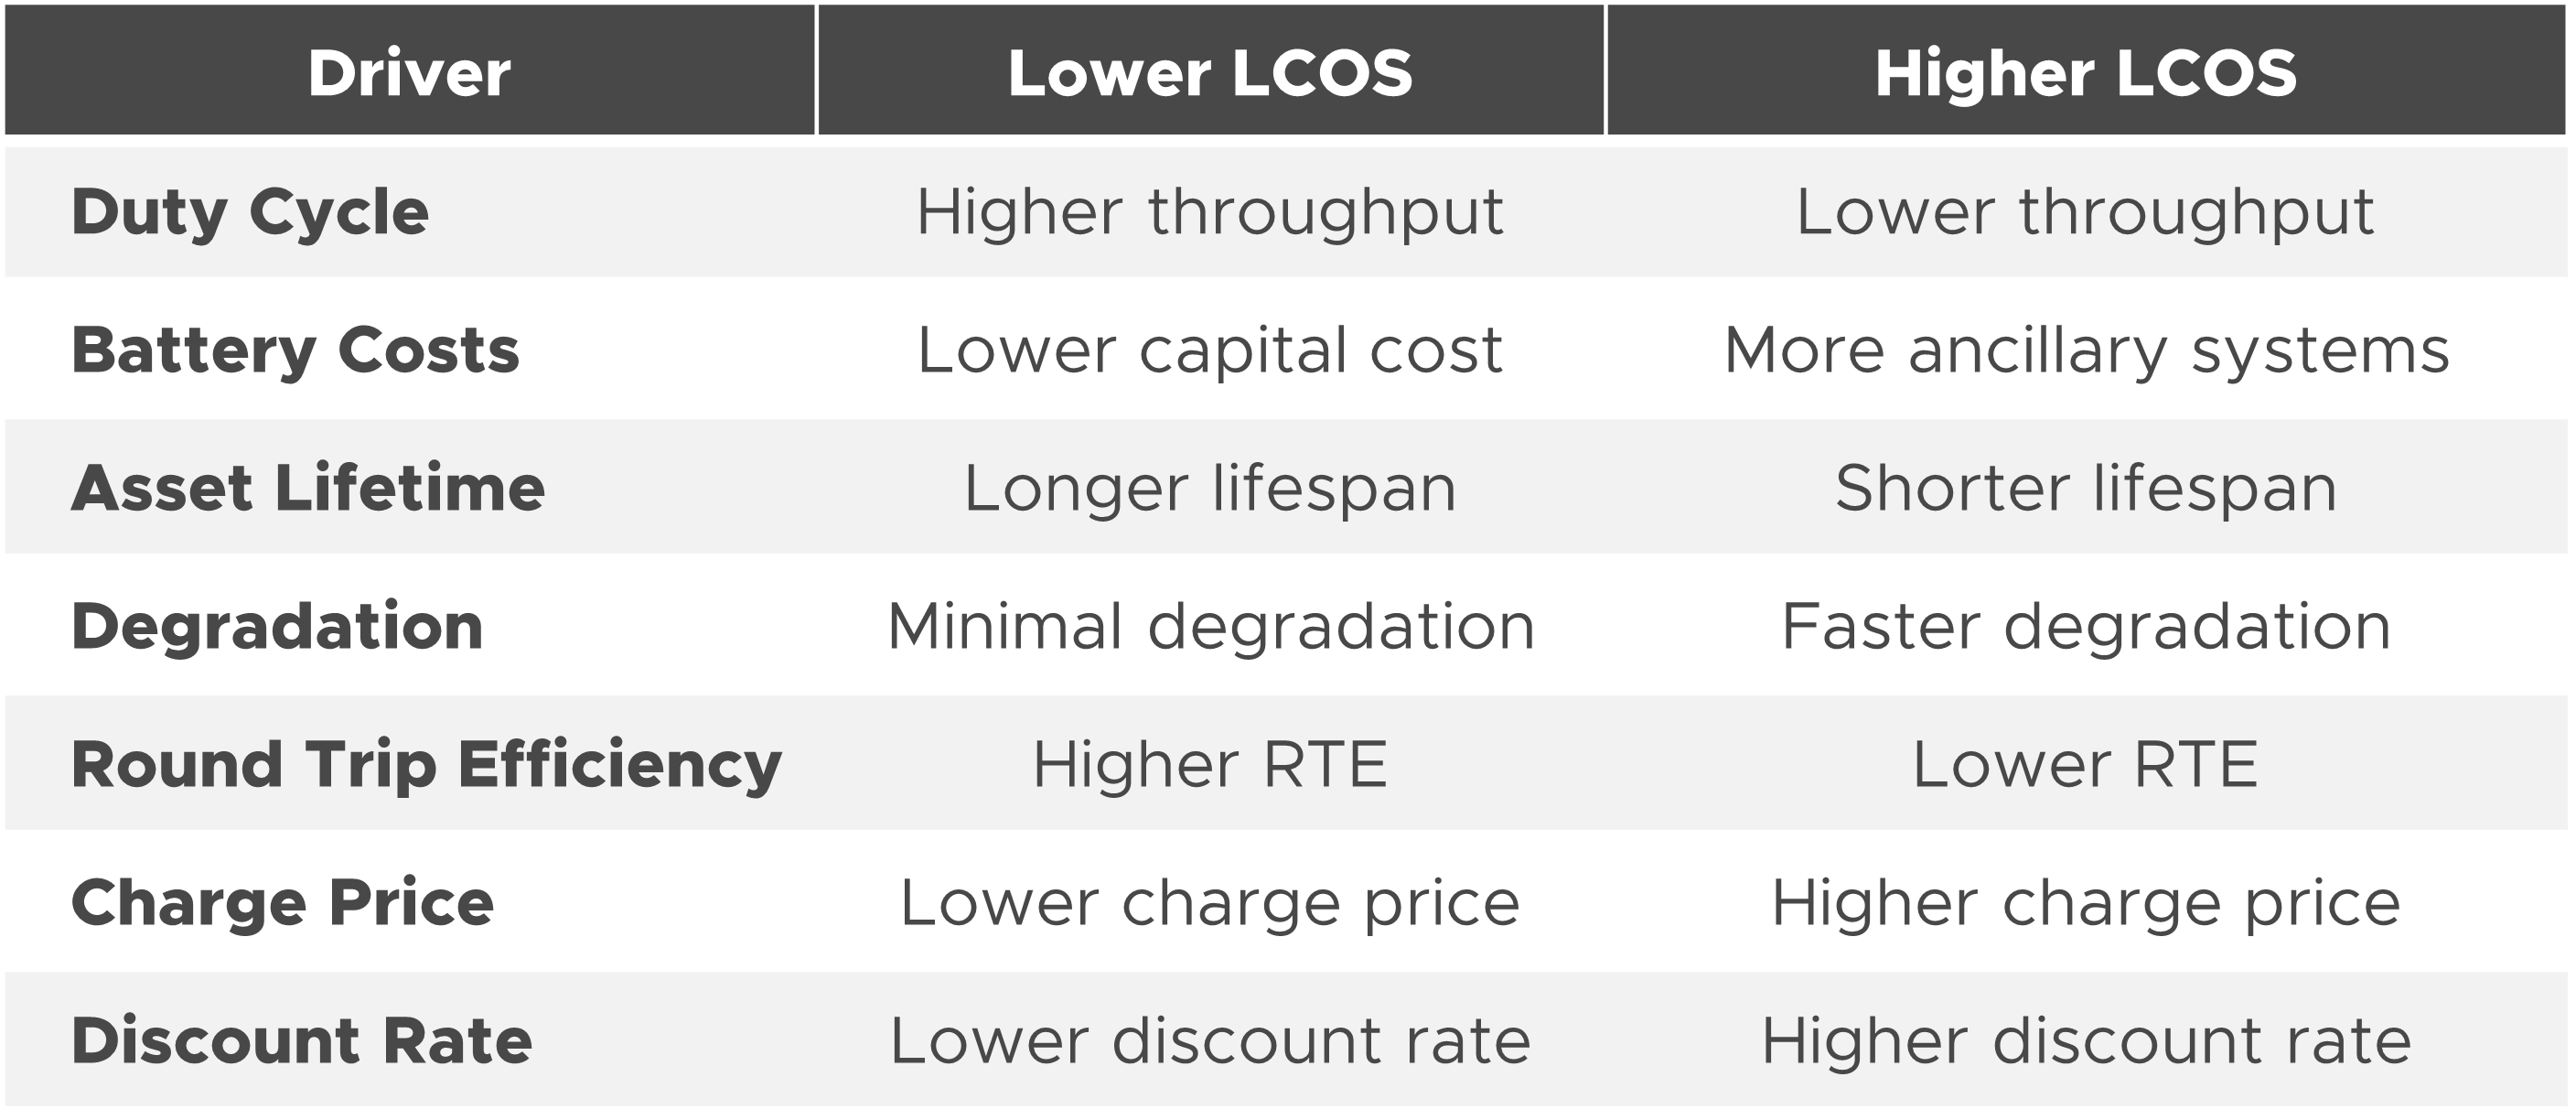
Figure 1. Major drivers of LCOS

/ Battery costs reflect your total upfront expenses before the battery even begins to do its work plus the ongoing costs of operating and maintaining it. Lithium-ion, as a mature and widely adopted technology, typically has a low capital cost per MWh; however increased demand for cells for electric vehicles is both limiting availability and raising prices. Costs also include ancillary systems like fire suppression, air conditioning and performance monitoring, if required.
/ Asset lifetime limits the amount of work the battery can do. A battery that can cycle 20,000 times over 25 years gives you a far greater energy throughput than one that cycles 5,000 times over 7 years with less energy delivered each cycle. Your costs per unit of energy are much lower in the first scenario.
/ Degradation occurs when a battery loses capacity over time. Some common grid storage batteries lose 20 or even 40% of their capacity during the first decade of service; efficiency decreases, too. Just like your cell phone battery as it ages, this means less capacity available per discharge, decreasing throughput and therefore increasing LCOS.
/ Round trip efficiency (RTE) is a measure of energy delivered versus energy used to charge the battery, expressed as a percentage. The higher the RTE, the lower the LCOS of a battery.
/ Charge price is the price at which you can charge the battery, which factors in heavily as well. Charging from your own solar array is very different to buying energy from a retailer or the wholesale market.
/ Finally, the discount rate will determine the relative value over time of costs and work done. LCOE and LCOS are calculations based on discounted cash flows, hence the need to apply a discount rate appropriate for your business. For example, a low discount rate suitable for regulated utility projects would overestimate economic returns expected by private developers.
Breaking Down the Major Components of Battery Storage Costs
A comprehensive list of line items associated with a battery project’s cash flow analysis can get quite granular, but we’ve found that there are five useful buckets in which to group battery costs. These buckets are helpful to conceptualize where and how you can shift costs based on your project goals.
Figure 2. Components of LCOS

/ O&M costs have both fixed and variable components. Fixed costs, for example, may include scheduled annual or bi-annual routine maintenance. Variable costs will typically vary with hours of operation or cycle count. And data costs are often overlooked: some lithium-ion manufacturers’ product warranties require operators to collect and maintain detailed operating data.
/ Augmentation or replacement costs represent a large chunk of lithium ion battery project costs today, but they are notably absent from non-degrading technologies such as vanadium flow batteries. With every cycle, a lithium-ion battery’s ability to hold charge degrades; to maintain battery capacity cells need to be replaced or added – a process called augmentation. This includes the cost of the new cells, the cost to swap them out, and the cost of any additional space.
/ End-of-life (EOL) costs may include include disassembly, transportation to a battery recycling facility and fees to safely dispose of lithium-ion cells. Some batteries have residual value when they reach the end of their useful life: vanadium electrolyte can be reused in a new battery, and NMC lithium ion batteries contain valuable metals that can be recovered and sold. Other chemistries like LFP have little residual value to offset EOL costs.
/ Efficiency Costs represent the cost of energy lost to round-trip efficiency (RTE). All batteries have an RTE less than 100%, but the figure varies across the range of available technologies available. This can dictate a battery’s ideal uses; for example, a vanadium flow battery requires a higher profit per cycle compared to lithium because of its lower RTE, but has better cycling capabilities making it ideal for high throughput regulation services.
We use LCOS in our model below, but if you prefer an LCOE model you would combine both charge and efficiency costs, yielding the total cost of energy delivered. As a reminder, charge costs are what it costs to get useful energy into your battery; if you’re charging the battery from the grid then wholesale prices are the other major driver of charge costs.
Battery Storage Cost Comparison: Vanadium Flow vs Lithium-Ion
Let’s look at an example of the LCOS cost breakdown for two different battery technologies performing the same duty cycle: a vanadium flow battery and a lithium-ion system. This is just one example, and different applications mean different inputs, but it demonstrates how relative costs can be quite different across technologies.
We’ll cover the formulas in a future article, but if you’d like to read more on how to calculate levelized cost of storage we’d recommend looking at the World Energy Council’s report on shifting from cost to value in wind and solar applications, the U.S. Department of Energy’s Energy Storage Grand Challenge Roadmap, the 2018 PV + storage cost analysis from NREL, or the University of Oxford study on the LCOE of PV & grid scale energy.
In this example we have modeled a grid-connected utility-owned battery co-located with a solar array, performing multiple daily cycles to serve deep wholesale and balancing markets. Such markets reward high-throughput systems: the more opportunity the battery has to do valuable work like solar shifting or performing energy arbitrage the more revenue it can earn.
Your scenario may be quite different, for example you may use a higher discount rate depending on your company’s cost of capital, or you might have a shorter project lifetime horizon; most utilities we speak to are using 25-40 year models today.
In this scenario, we assume a 10 MW / 40 MWh battery with a high throughput equivalent to 700 full depth of discharge cycles per year; that’s a little under 2 cycles per day with an availability of 96%. We’ve modeled a 6% discount rate over a 40 year project life.
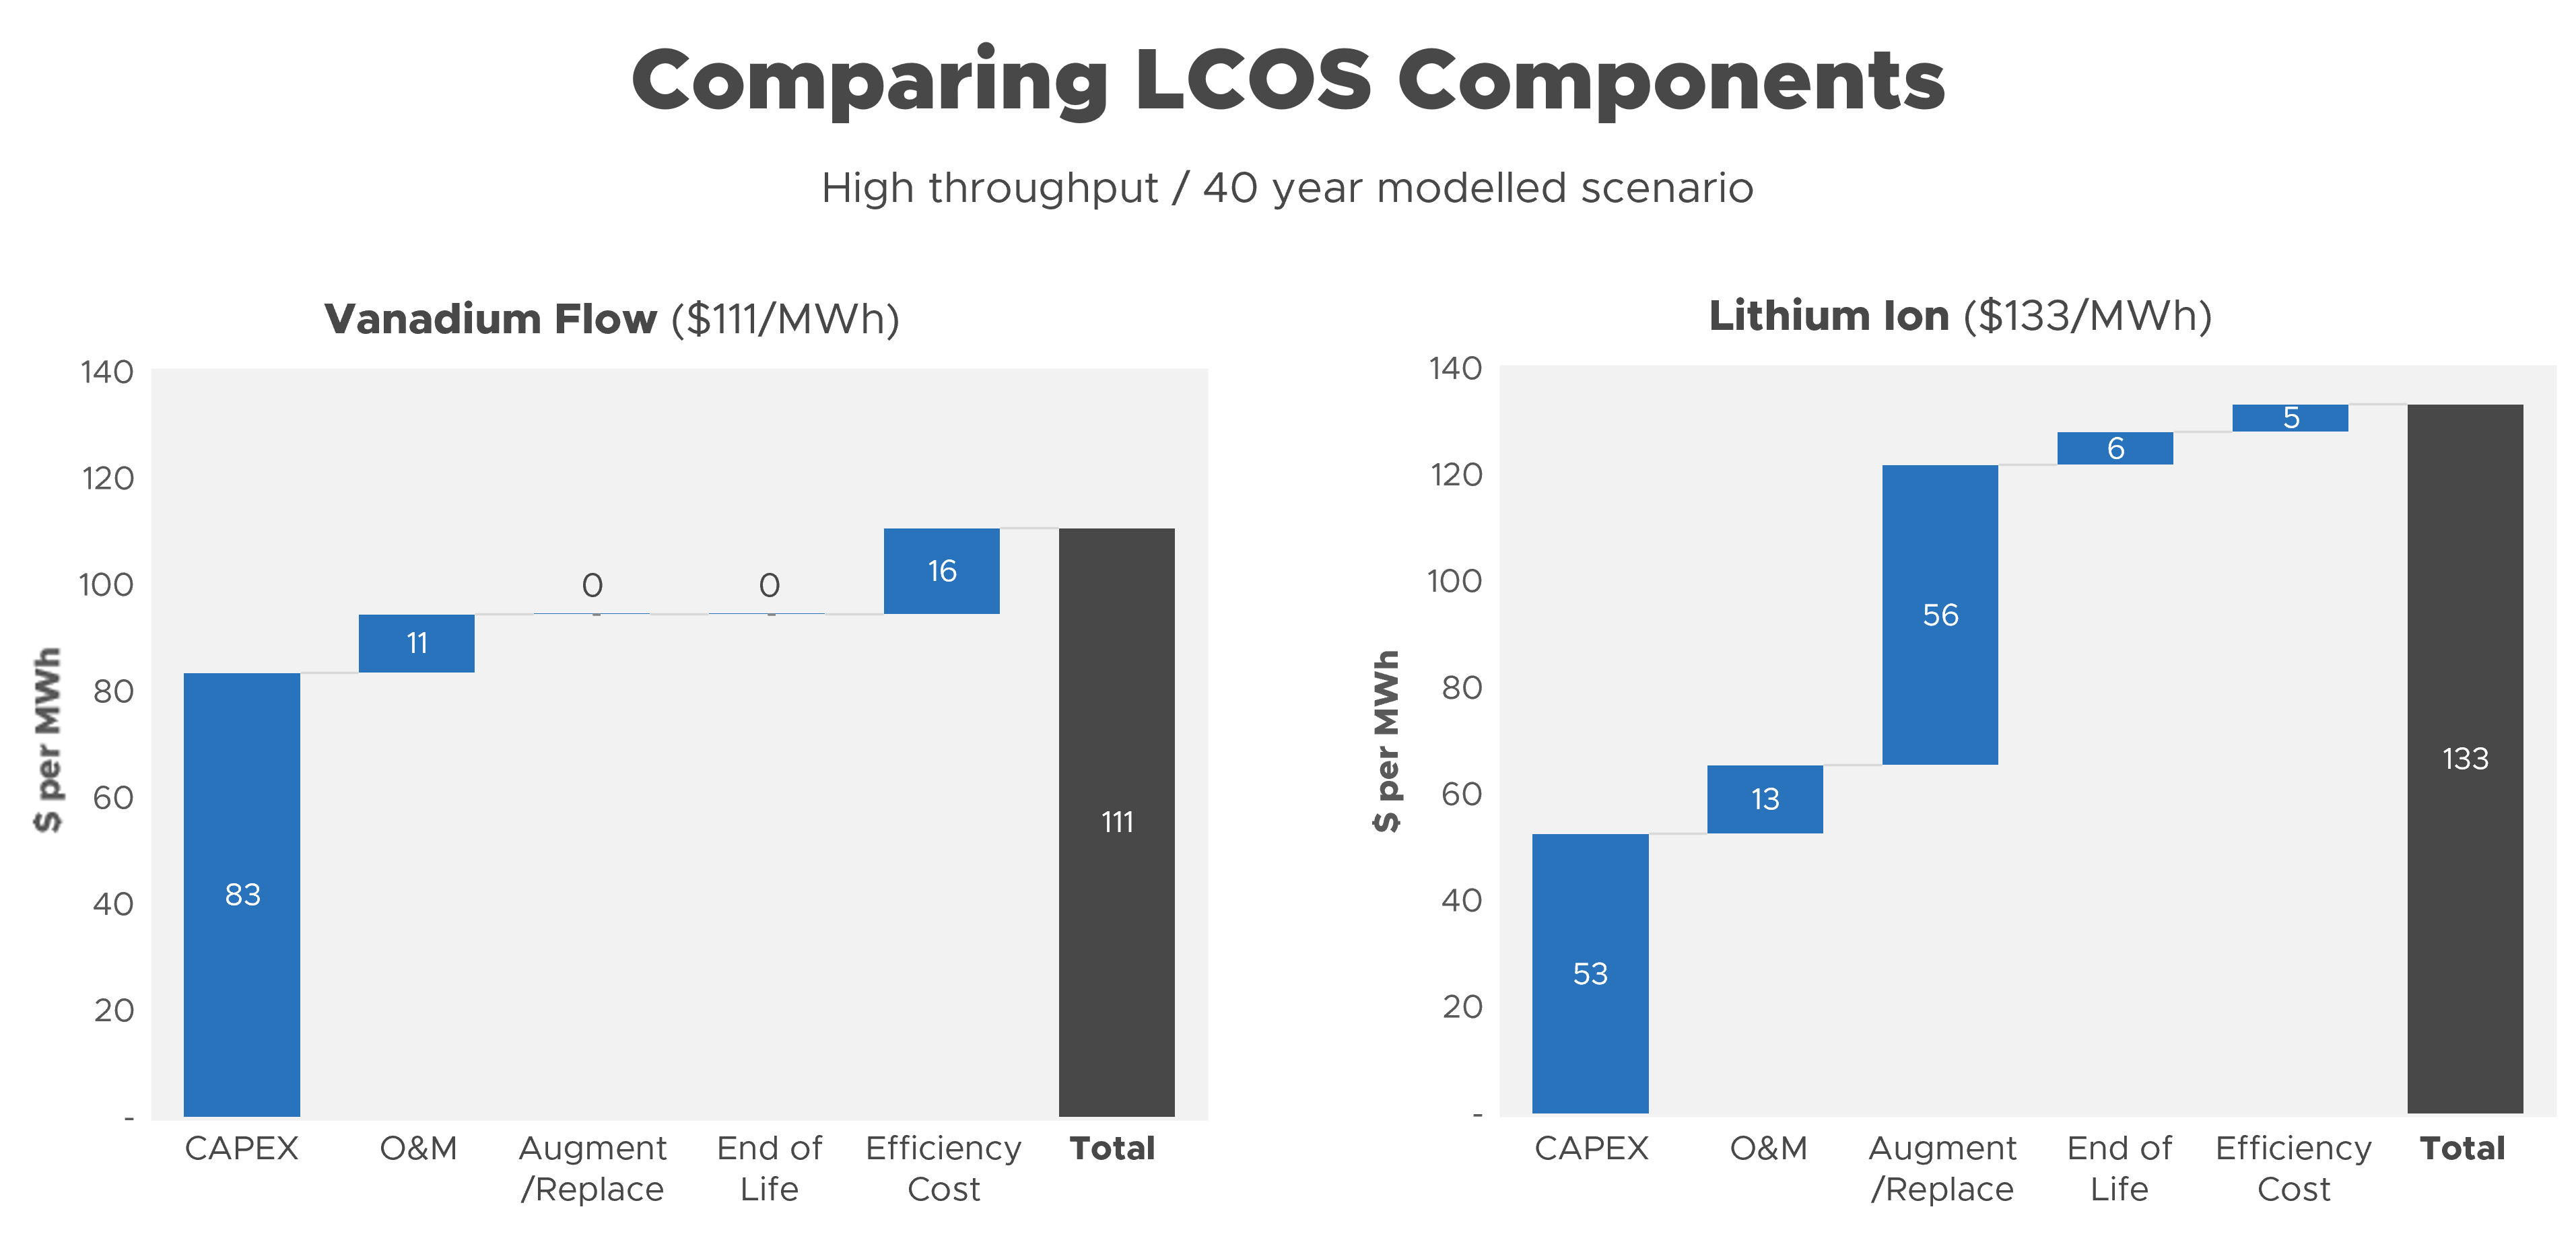
The LCOS for the two systems are quite different ($111/MWh for the VFB vs $131/MWh for the Li-ion), and the composition of that cost varies as shown in figure 3.
Figure 3. Battery Storage Cost Comparison

Due to lithium’s more widespread commerciality, its CAPEX cost per project is likely lower than other technologies that do not yet benefit from automotive-scale manufacturing. In contrast, as VFBs are only now beginning to capture significant market share, their CAPEX currently ranges from 1-2x that of a lithium ion battery. In this scenario, the estimated CAPEX works out to $83/MWh for the VFB vs $53/MWh for the lithium LFP system.
O&M comes in slightly lower for a vanadium flow battery ($11/MWh vs $13/MWh), mostly driven by the fact that there are fewer auxiliary systems such as fire detection and fire suppression to test and maintain over time.
Augmentation (or in similar analyses, replacement) costs are significant for the lithium ion system ($56/MWh) which degrades at about 4.7% a year based primarily on cycle count. These costs are minimal for the vanadium flow battery which exhibits zero degradation based on cycle count.
End of life cash flows are divergent. The vanadium electrolyte retains a positive end of life value which can be used to offset any recycling costs. In contrast, the lithium ion battery, assumed to be LFP which accounts for most sales today, has end-of-life costs which push LCOS up by $6/MWh.
Finally, there is some difference in efficiency costs as well. While both batteries charge from the same sources, the lithium ion battery has a higher RTE on day 1, it degrades with cycle life and is only fractionally recovered through augmentation. As a result, both batteries incur costs due to efficiency losses: the VFB costs $16/MWh of throughput over the lifetime of the battery, vs. $5/MWh for the lithium ion battery.
Final Thoughts on Battery Cost Estimates
As you can see, calculating battery storage costs depends heavily on the operational profile of the battery and the technology you choose. There are choices and tradeoffs, but by understanding the cost drivers and the interplay between them, you can choose the best technology solution for your project.
Invinity’s team of expert analysts have years of experience modelling LCOS for projects in front of and behind the meter, in markets the world over. If you are in the planning stages of an energy storage project today, we invite you to contact us today to start a discussion with our team.